Unraveling The Mystery Of Stock Prices
Here’s a simple method you can apply to interpret financial charts. It uses classical statistics as well as a number
Uncategorised
Displacement issues
Q: TradeStation, Ninja Trader and other trading platforms allow showing indicators with some displacement against original price chart. How we
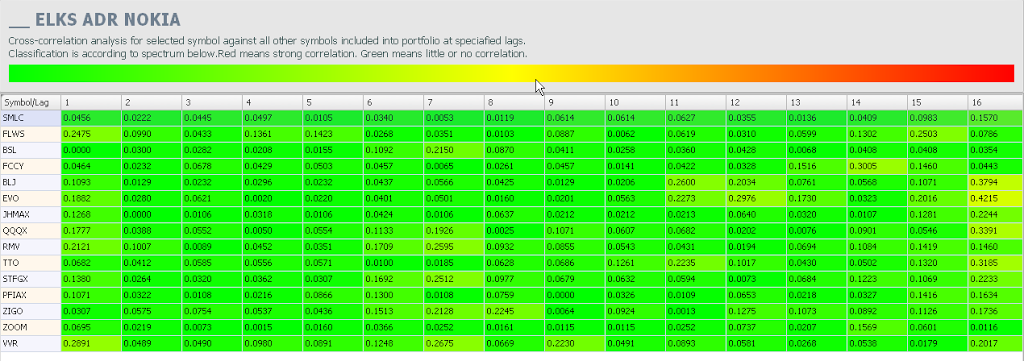
Lag correlation analysis
StockFusion Studio includes the powerful lag correlation matrix for discovery of symbol dependencies. It calculates cross correlation of selected symbol
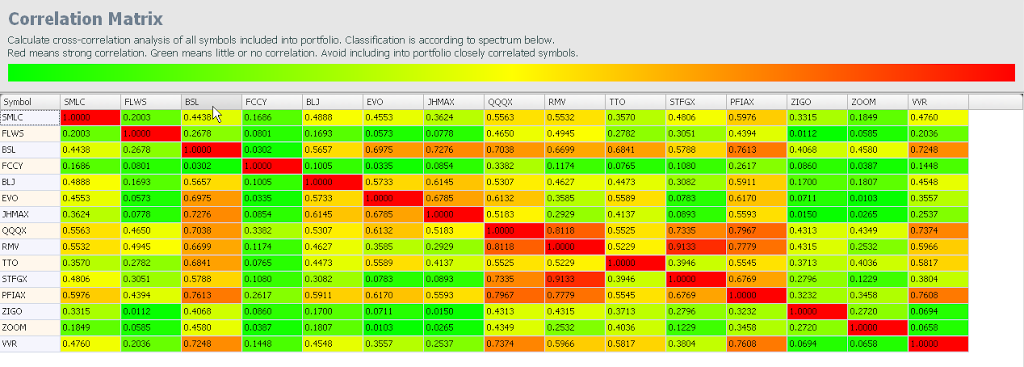
Portfolio correlation matrix
Portfolio correlation matrix is the powerful tool for your portfolio optimization. It allows optimal portfolio balancing be excluding from it
Uncategorised
Adding new symbols to symbol lookup list
It may eventually happen that your favorite symbol is not present in our Yahoo symbol lookup database, for example, due
Uncategorised
Yahoo exchanges
StockFusion Studio supports all world exchanges EOD data free of any subscription fees with its new Yahoo data provider. All
Uncategorised
The accuracy of trading performance back testing
Even beginner trader is well aware how important is testing of trading strategy on historical price data to estimate its