Posted by bzinchenko on Jul 8, 2012 in Uncategorised
Q: When I use the Radar-Calculate buttons to scan a group of stocks, a table named “Portfolio Optimizer” will appear. In this table, one algorithm is assigned to each stock. However, the Profit % related to each stock is zero. Judging from the list of algorithms alone, with no information on the Profit %, how do I know which stock is the best performer? A: Radar screen should be manually calculated to display actual up to date values for every symbol in your portfolio....
Read More »
Posted by bzinchenko on Mar 6, 2012 in Uncategorised
Q: In some cases, indicators have some points missing or are completely void. Does it mean that system does not work? A: We offer the full-fledged expert system in market forecasting. Unlike the vast majority of simple technical indicators, it makes very complicated market modeling to produce expert inference on the future market trends. As any real expert, out technology cannot always have the exact opinion on the market trend. In some cases, it may have just not enough...
Read More »
Posted by bzinchenko on Jun 14, 2011 in Uncategorised
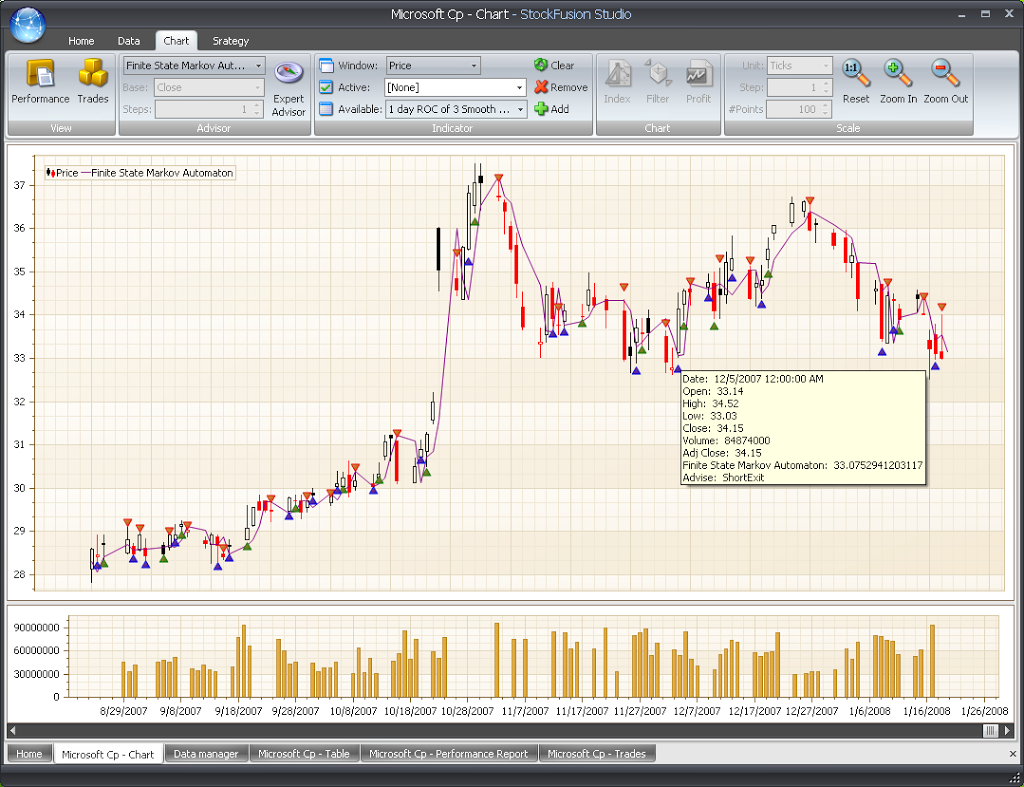
Q: What is the main purpose of using the indicators? Are they just for visual display? If I press the Expert Advisor button, will the indicators on display be put into the subsequent calculation process and affect the result? A: In contrast to forecasting algorithms, which pretend using historical data about a time series to foresee its future behavior, technical indicators typically depict some aggregated characteristics of a time series in the past. Even despite these...
Read More »
Posted by bzinchenko on May 6, 2011 in Uncategorised
Q: When I insert moving averages into a price chart, they appear together with the price curve (in candlesticks form); that is OK. However, when I insert oscillators, they appear at the lower part of the same chart (not in separate windows), making the upper part (price curve + moving averages) highly compressed and illegible. Can I display oscillators in separate chart/window below the price chart to leave more space for the latter? A: On the chart ribbon find...
Read More »
Posted by bzinchenko on Nov 1, 2010 in Uncategorised
Futures, Forex and Equities Trading Strategies on Your Favorite Dealing Platform.
Read More »
Posted by bzinchenko on May 2, 2010 in Uncategorised
Here’s a simple method you can apply to interpret financial charts. It uses classical statistics as well as a number of simple chart indicators, which may help you better understand classical charts from the viewpoint of random processes. Every trader is familiar with stock charts. To most traders the chart is just a common tool, like a hammer is to the carpenter. The exception is the new trader reading charts for the first time or the advanced trader who begins to...
Read More »