StockFusion Studio

StockFusion Studio 2.0 is the new generation of intelligent trading advisor based on unique Aura Forecast Engine (patents No 2003611241, 2003611242). Product is based on many years of studies in nonlinear stochastic dynamics and turbulence theory applications to the short term fluctuations of world markets performed in the Russian Academy of Science. It comprises the wide variety of market forecasting algorithms including seasonal ARIMA, Stepwise Best Regressions, Finite State Markov Automation offered as ready to use adaptive trading strategies with adjustable trading commission correction and threshold trade triggers.

Automated expert system instantly selects the best strategy for every market symbol by using elaborate nonparametric statistics such as Friedman coefficient, Hurst coefficient, fractal dimension, K-Sample and Kruskal-Wallis tests, Shannon probability, asymmetry, excess, correlation radius and many others. Applied together these tools allow to achieve unique accuracy in sharp trade signals ensured with true recurrent back testing over the whole trading history of each symbol.

Free unlimited data access to all world stock universe is the courtesy of integrated Yahoo finance downloader service. Additional data sources include direct connectivity to Equis MetaStock®, CSV text worksheets, TeleChart 2008® and QuotesPlus® data warehouses as well as own native SQL drivers to Microsoft Access® and Microsoft SQL Server®, IBM DB2® UDB, Oracle® 10i.

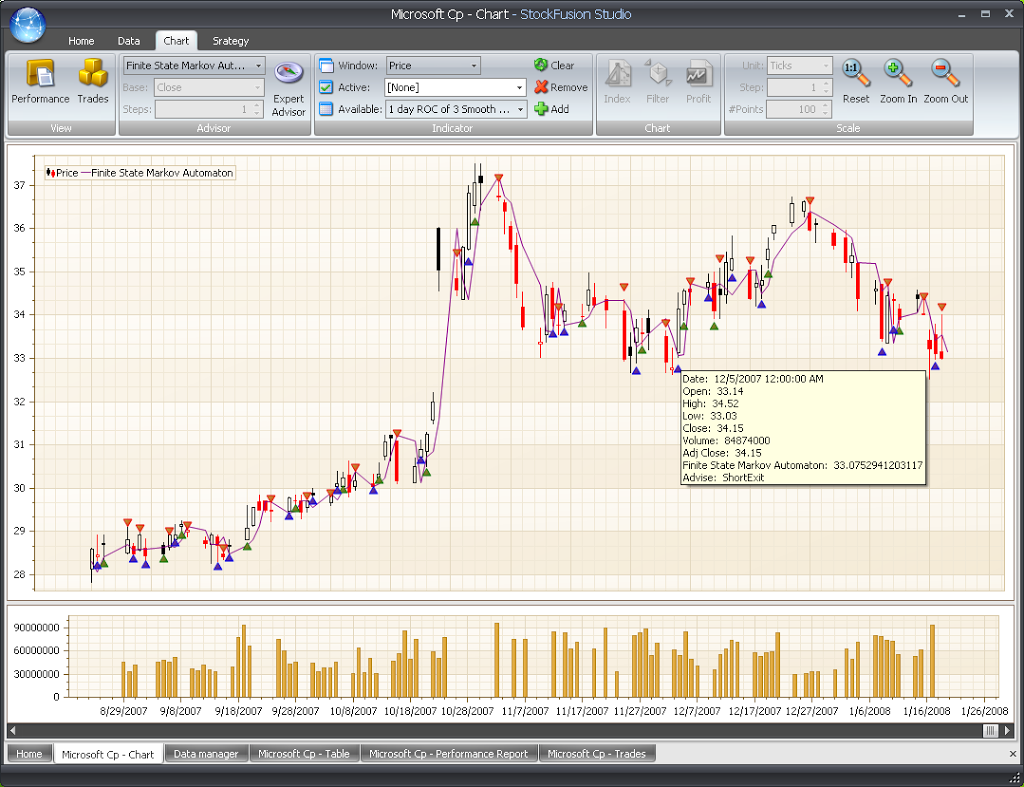
Stunning Vista style user interface offers unique charting abilities with over a hundredth of technical indicators available in multiple concurrent charting windows with arbitrary drill down scaling. Concise trading performance reports and trade history listings are ready exportable into MS Office format. Batch system scan offers one click automatic optimization of the whole user portfolio.

Free open API enables unlimited system extensibility both in data access and additional forecasting technologies which then are natively consumed in system kernel expert reasoning. SOAP, DCOM and C++ bindings give easy direct integration with virtually any enterprise infrastructure including Java, NET, Delphi, MS Office, online portals and interactive web services.

Walk forward test

Q: We all know that future performance does not resemble past performance. If I have found a good trading model for a stock, should I perform some walk forward test? If yes, how can I reserve some price data (which has never been seen by the model) for the walk forward test? Technically, how can I conduct the test?
A: Our models are purely statistical. We took every care to avoid any chance of using forward info or any other technique, which could compromise optimization results in live trading. One could expect that the models will perform in future approximately same as they did in the past. At least as far as fundamental statistics will not completely change for given symbol.
walkfwd2

Best model selection

Q: I am not sure about the proper means to assess the quality of a trading model (algorithm plus trading strategy) for a given stock. Is it purely based on the Performance Report? So, the model giving the highest % of winning trades and highest net profit should be the best? However, in most cases, the Expert Advisor does not give the best trading model in terms of performance report – why is that so?
A: Expert advisor selects the model with the best net profit. It does not relate to the number of winning trades. For instance, the strategy may well have the number of loosing trades exceeding the number of winning trades, while the average profit per winning trade will increase the average loss of loosing trades. Such a strategy will still be profitable. Therefore, we consider net profitability as the only reliable measure of efficiency of a strategy. It is combined, of course, with special statistics estimating stability of the results.
Best model selection

Predictors and indicators

Q: Some algorithms in user guide are referred as predictors, others – as indictors. What is the difference between these two kinds of algorithms in trading usage?
Price action
A: We offer classical indicator style algorithms intended as the analysis tool for historical data and as an auxiliary supplement in building custom strategies by the user. Indicators are very similar in their usage to the standard technical indicators common in most trading platforms.
Predictors, even though very similar in display to indicators, are much more elaborate algorithms in mathematical sense. They are designed not to simply monitor the price dynamics, but to predict future dynamics depending on existing historical prices. Predicted future price serves as the advice to trader to make immediate decision on the current positions to maximize returns. Trader may wish to perform certain actions depending on the predicted price change. For instance, trader may wish to close position, if he will see that the price is likely to move down on the next bar, according to predictor. In this way, predictors serve as precise trading advisors.

Recurrence of results

Q: We run your system several times on the same or slightly changed input data and obtain the results, which do not match exactly in each case. Does it mean that the results are unstable and not trustworthy?
A: Our expert system contains very complex forecasting algorithms. It includes wavelet regressions, neural networks, complex statistical optimizers and nonlinear filters. These technologies involve calculations thousands times exceeding in volumes all typical indicators supplied with trading platforms. All computers operate on finite precision arithmetic. It typically has 15 digits accuracy. In very long and complex calculations even small discrepancies tend to sum up and bring noticeable divergences preventing the results of several runs to coincide exactly even on the same data supplied. What matters here, is the tendency in behavior of such errors.
If the results of several consecutive runs do not differ considerably and has the tendency to match exactly with the increase in the input data volume, then we can tell that algorithm is stable and has the convergence point in the multidimensional phase space. In other words, we can say that algorithm has attractor, which guarantees statistical accuracy and consistency of the results on the ensemble of representative input statistics. Convergence is governed by Lyapunov exponents and other chaos measures. This style of convergence escapes full literacy and exhibits sporadic misfits and other phenomena. Key indicator is then steady decrease in the number and amplitude of such deviations with increase of data series length, which indicates underlying model convergence to stable result in terms of its phase space.
Results of all our algorithms generally coincide in consecutive runs. Coincidence is, however, not literal because of convergence aspects of inner optimizers. On short data series, coincidence is poor or even completely absent due to statistically insignificant data. Coincidence much improves on longer series and gets better with additional data added in most cases. It indicates correct model structure and its applicability to market forecasting. In many cases, good reproduction of results requires quite long data series of thousand points and more. Exactly this statistical convergence gives our technology fundamental benefits over the most common technical indicators.
eternal-recurrence-600x383

Optimal market depth

Q: User manual gives special table of allowed input lengths for each algorithm. Why different algorithms require different length of input data? How we can choose this length optimally in each case to achieve the best performance?
Optimal market depth
A: We offer algorithms of different complexity levels. Simple algorithms typically work well on very short input data. However, many algorithms are adaptive. It means that they automatically adjust their settings based on input data to achieve best forecasting performance.
As with humans, algorithms have only one way to learn – they learn on the previous experience. This experience is passed to algorithm in a form of market history. The longer history is provided, the better experience will have algorithm to learn. As with humans, there is no guarantee that algorithm will learn well, provided it has good initial data. However, not giving enough data is solid guarantee that even good algorithms will have no experience to educate on it properly.
Each algorithm has the minimal survival data length. Without minimal data, it simply cannot live and operate. All initial data points on chart will be just void until this minimal limit is reached, indicating that algorithm is not operational until enough data history has been collected. However, it means exactly the survival limit. Calculation starts immediately as soon as the limit is reached. Nevertheless, it does not mean that calculation on these limit condions is perfectly accurate. Algorithm with the minimal data is as the newborn baby: it is very unnatural to expect from it to be market genius. You must teach it with enough historical data to expect better professional expertise. The more data you provide the better results you can expect.
On another side, the calculation time grows with the amount of data. On the real time stream forecast will appear useless, if it arrives later than the forecasted event really happens. Hence, the user must choose the balance between the desired accuracy and the allowed data depth to get the timely market advises depending on performance of computer.

Profit percent on radar view

Q: When I use the Radar-Calculate buttons to scan a group of stocks, a table named “Portfolio Optimizer” will appear. In this table, one algorithm is assigned to each stock. However, the Profit % related to each stock is zero. Judging from the list of algorithms alone, with no information on the Profit %, how do I know which stock is the best performer?
A: Radar screen should be manually calculated to display actual up to date values for every symbol in your portfolio. Use “Calculate” button above radar view to start calculation. If portfolio contains many symbols, this calculation may take a significant time depending on the performance of computer. Watch progress of calculation in status bar on bottom of the main window. All fields on radar will be filled with appropriate values when calculation completes. Do not forget calculating portfolio before inspecting the results.

Missing values in indicators

Q: In some cases, indicators have some points missing or are completely void. Does it mean that system does not work?
A: We offer the full-fledged expert system in market forecasting. Unlike the vast majority of simple technical indicators, it makes very complicated market modeling to produce expert inference on the future market trends. As any real expert, out technology cannot always have the exact opinion on the market trend. In some cases, it may have just not enough data for that. Then the user is responsible to provide more market depth to algorithm to expect more accuracy. In other cases, data appear just too volatile or dubious to make any clear expert decision. In such situation, expert system gives the void result, which means “no clear advice available on the moment”. As any professional and honest expert, our system is not afraid to admit its limitations in certain situations. It is much better to sustain from advice, if conditions are vague, than giving false advise and provoking possible losses. 

Purpose of technical indicators

Q: What is the main purpose of using the indicators? Are they just for visual display? If I press the Expert Advisor button, will the indicators on display be put into the subsequent calculation process and affect the result?
A: In contrast to forecasting algorithms, which pretend using historical data about a time series to foresee its future behavior, technical indicators typically depict some aggregated characteristics of a time series in the past. Even despite these patterns might be looking attractive in terms of predicting the future trends, they typically rely on certain time lags in revealing the tendency. We generally believe that indicators are useless in market prediction. They are added merely to satisfy the people familiar with other platforms. We do not use indicators in market forecasting and strategy calculations. Only predictors take part in a strategy optimization.

Indicators in multiple windows

Q: When I insert moving averages into a price chart, they appear together with the price curve (in candlesticks form); that is OK. However, when I insert oscillators, they appear at the lower part of the same chart (not in separate windows), making the upper part (price curve + moving averages) highly compressed and illegible. Can I display oscillators in separate chart/window below the price chart to leave more space for the latter?
A: On the chart ribbon find “Indicator” group. Use it to manage indicators.
  1. Select from up to four available chart panes in “Window” combo box on top.
  2. Select any indicator in “Available” combo box on bottom.
  3. Hit “Add” button to add selected indicator to selected window.
  4. Indicator will move into combo “Active”, containing all selected indicators.
  5. New window will appear showing the selected indicator, if it was now visible before.
  6. Hit “Remove” button to remove selected active indicator from chart.
  7. Hit “Clear” to remove all indicators from all charts.